> ## Documentation Index
> Fetch the complete documentation index at: https://documentation.suby.fi/llms.txt
> Use this file to discover all available pages before exploring further.
# Analytics
> Track your revenue, customers, and growth from your dashboard.
Suby's analytics dashboard gives you a real-time view of your business performance. All data is filterable by period and exportable as CSV.
## Metrics
Cumulative revenue over time, gross vs net (after fees and refunds), and breakdown by product.
Total customers over time, new customers per period, and breakdown by product.
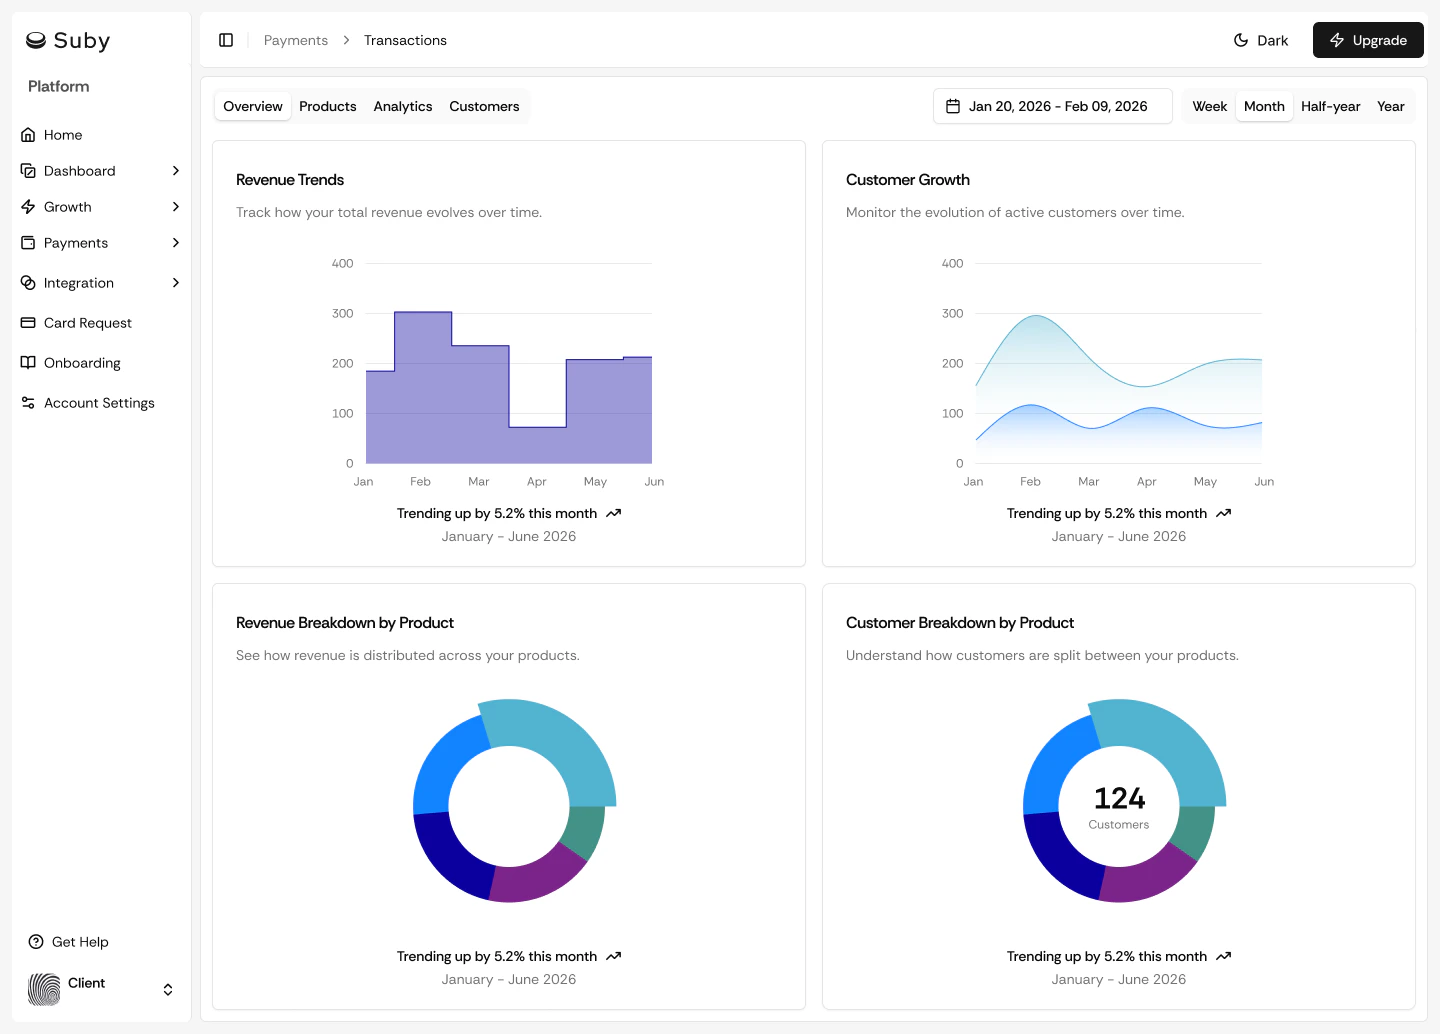 ## Time Filters
Filter all metrics by any of the following periods:
| Period | |
| ------------- | ---------- |
| This week | This month |
| Last 6 months | This year |
| All time | |
## Breakdown by Product
Every metric can be filtered by product, useful if you have multiple subscription tiers or a mix of one-time and recurring products.
## Exporting Data
Navigate to **Analytics** in your dashboard.
Select your period and product filters.
Click **Export** and download your CSV.
The export includes all transactions and customer data matching your current filter selection.
## Time Filters
Filter all metrics by any of the following periods:
| Period | |
| ------------- | ---------- |
| This week | This month |
| Last 6 months | This year |
| All time | |
## Breakdown by Product
Every metric can be filtered by product, useful if you have multiple subscription tiers or a mix of one-time and recurring products.
## Exporting Data
Navigate to **Analytics** in your dashboard.
Select your period and product filters.
Click **Export** and download your CSV.
The export includes all transactions and customer data matching your current filter selection.