

Metrics
Revenue
Cumulative revenue over time, gross vs net (after fees and refunds), and breakdown by product.
Customers
Total customers over time, new customers per period, and breakdown by product.
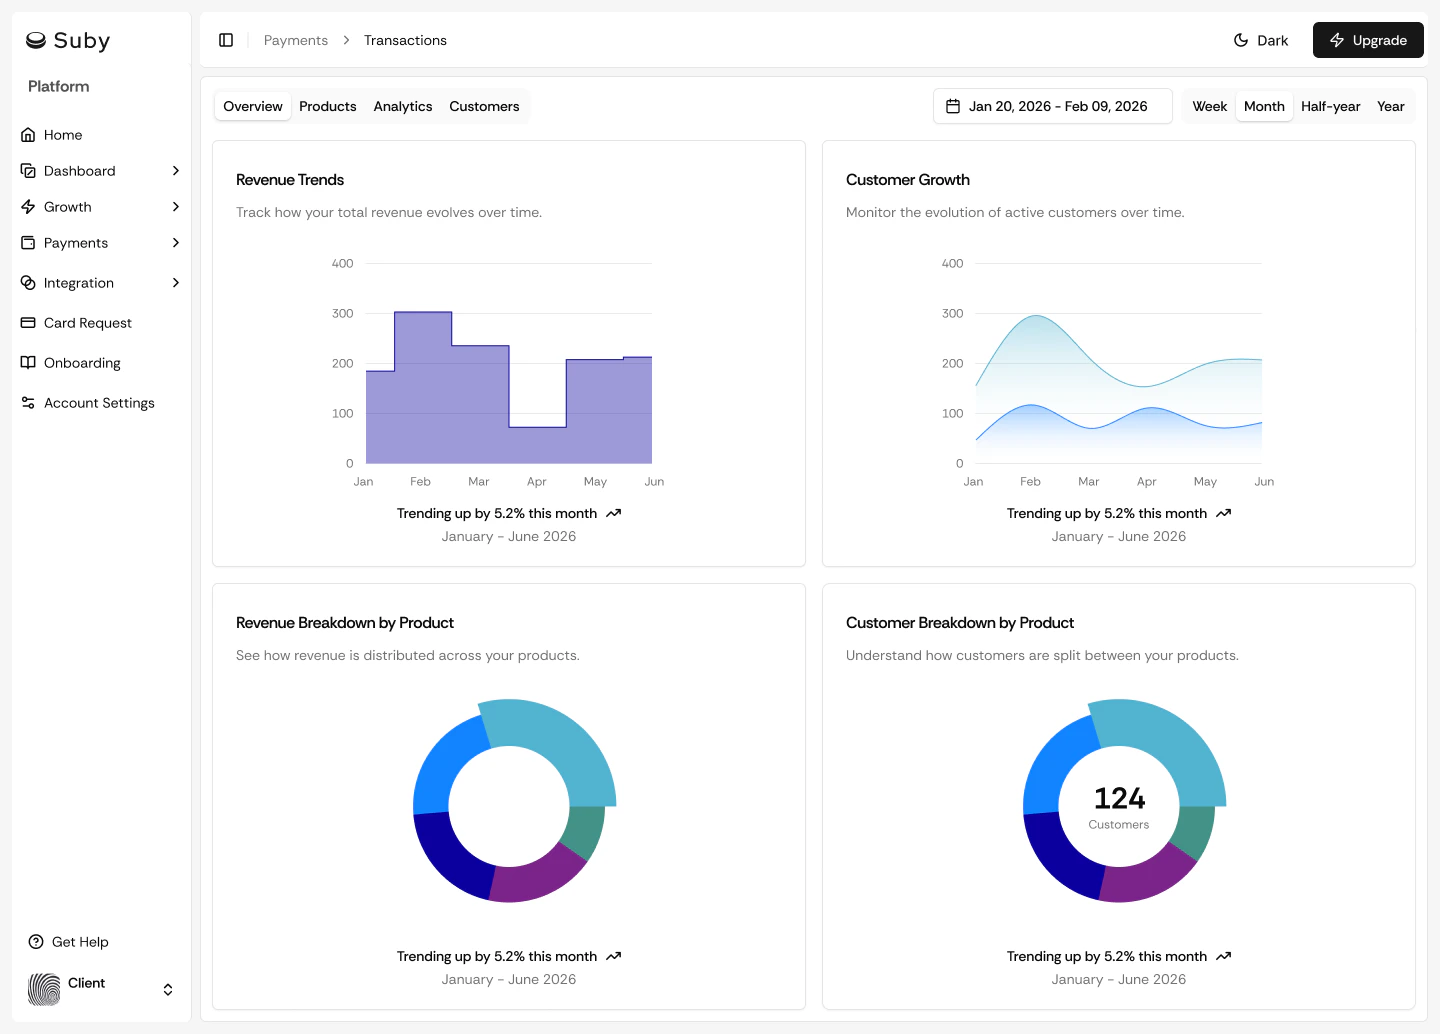
Time Filters
Filter all metrics by any of the following periods:| Period | |
|---|---|
| This week | This month |
| Last 6 months | This year |
| All time |
Breakdown by Product
Every metric can be filtered by product, useful if you have multiple subscription tiers or a mix of one-time and recurring products.Exporting Data
The export includes all transactions and customer data matching your current filter selection.